Day-5 Chautauqua 2011 — Radio Astronomy at Green Bank
Background
Every summer the University of Dayton organizes a series of short courses in the sciences that bring together college faculty with scholars at the forefront of research as part of the Chautauqua Program. The primary aim of the Chautauqua Program is to enable undergraduate science teachers to keep their teaching current and relevant to what is being investigated today by top researchers. The short courses are usually two and half days long at the place where the researchers are working so courses can take place all over the nation. Although the college faculty coming to the short course usually have a science, math, or engineering background, most do not have much formal training in the subject of the short course. At the short course at the National Radio Astronomy Observatory at Green Bank, WV I attended in June 2011, just a couple of the participants taught an astronomy course and a couple of others taught some astronomy as part of a physical science class. The rest had some sort of technical background. Because it cannot be assumed that the participants in the Chautauqua short course have much background in the subject of the course, the researchers giving the lectures will try to pitch their lectures at the level of a talk to interested laypeople.
Other universities including the University of Washington, the University of Texas at Austin, University of Massachusetts, California State University Dominguez Hills, Stony Brook University and the University of Pittsburgh were also field centers when the program was funded by the National Science Foundation. Since the NSF subsidization ended in 2008, the number of field centers and course offerings has decreased and the cost for participants has risen but the course costs are still less than attending many of the professional conferences. I was fortunate to receive funding from the Norman Levan Center for the Humanities at Bakersfield College as part of its faculty summer grant program to help pay for attending this course and its follow-up course on 21st-century Astrophysics at the Very Large Array in Socorro, NM. A minimum number of participants is required for a course to take place and the Green Bank course this year almost did not reach quorum, though I found it to be among the most interesting of the Chautauqua short courses I have attended over the years.
My own reasons for attending the course were to better inform my teaching of current science methods in my astronomy classes and to learn up close about the instruments that are responsible for more research publications than any other telescope. The Green Bank course was unique among the Chautauqua courses I have attended in that besides the usual lectures by research scholars, the participants also got to do a project using one of the radio telescopes. The participants had a choice of projects to do and the rest of this report will describe the project I worked on. [A photo tour of Green Bank NRAO is now available.]
New Arm of the Milky Way
A week before the course took place a new paper by Dame and Thaddeus was circulating at the Green Bank NRAO announcing the discovery of a new spiral arm of the Milky Way detected in the radio band. Although the signs of the arm had been seen in earlier 21 cm surveys, they were the first one to "connect the dots" and make a convincing case for the existence of the new arm and to also see it using the 2.6-mm line of carbon monoxide, a known tracer of molecular hydrogen gas (recall that 21 cm is from neutral atomic hydrogen). Two other participants (Andrew Dooley and Roger Young) and I took on the project of seeing if the new arm could be seen with the 40-foot telescope. We think we did. Next year the lead EPO person at Green Bank, Sue Ann Heatherly, will have a more formal project written up about the new spiral arm, but the goal this year was to simply see if the arm could be detected with the 40-foot telescope.
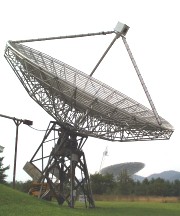 The 40-foot telescope was built in the early 1960s to detect variable radio sources and then recommissioned in 1987 as an educational telescope. It is designed to observe in the wavelength range of 20.96 cm to 22.22 cm (1350 MHz to 1430 MHz). Radio waves hit the parabolic reflector made of steel mesh 40 feet across and are focussed up to the prime focus position in front of the metal mesh. At the observing wavelengths, the steel mesh is a solid reflecting surface. The receivers are in a box held up by three support rods at the prime focus position. The receiving equipment amplifies the very weak celestial radio signals by a factor of over two million times. Because all of the radio telescopes at Green Bank are single-dish instruments (and not part of an interferometer), they are especially sensitive to radio interference from man-made and other terrestrial sources. Such radio interference includes the wi-fi antennae in laptops, cell phones, spark plugs in gasoline engines, and even the radio energy produced when information is written from the CCD chip of a digital camera. Because of this I couldn't take any pictures of the telescope and other equipment, so we'll just have to make do with the image at left from the Green Bank website. Green Bank resides in the only National Radio Quiet Zone in the United States of dimensions roughly 114 by 114 miles on the Virginia-West Virginia border. The nearby hills help shield the facility as well as the small likelihood that the town of Green Bank will grow any larger (though wireless routers in people's homes are a growing problem).
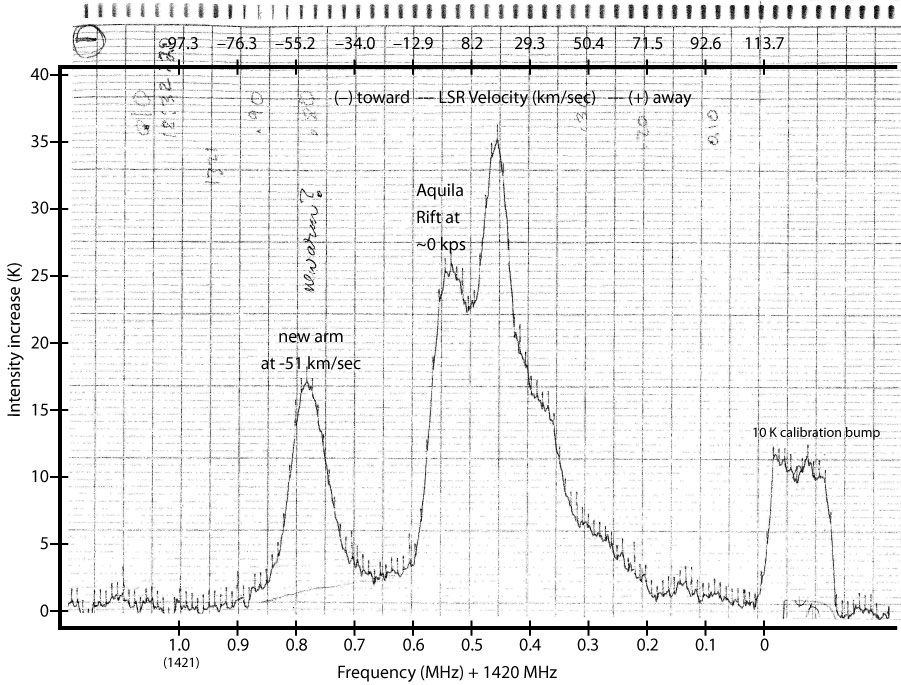
Even more important to know about the 40-foot telescope is that the 40-foot is a transit instrument: it sees objects only on the meridian. Therefore, one has to wait for the Earth's rotation to move the object to being on the meridian. The telescope can be moved up-down in declination. For our project observing the new arm in early June, this meant observing at around 2:30 to 3:30 AM (when our brains were probably a bit fuzzy). The preceding afternoon we had a brief tutorial on how to use the telescope. The amplified radio energy is converted to a voltage, amplified further, and averaged over an integration time. The averaged voltage is used to deflect chart recorder pins on a strip of paper that is forwarded at a set rate. One of the team manually increased the frequency setting of the receiver by pushing a button at the controls every second. The result is a plot corresponding to H1 intensity (y) vs. frequency (x) with a lot of minor spikes added by the strip chart system every one second of time. One of the key plots is shown below. I added the axes with labels and velocity scale later (select the image to bring up a larger version). The radio telescope's motion with respect to the local standard of rest was found using the Vlsr calculator at http://fuse.pha.jhu.edu/support/tools/vlsr.html and for the time and direction of the scan, it equals -27.16 km/sec. The local standard of rest is a point at the Sun's distance from the galaxy center that moves around the galaxy center in a circular orbit. At the time of this scan (2:50 AM EDT on June 7th) we were pointed toward galactic longitude l = 27.8 deg and galactic latitude b = +3.3 deg. We kept the telescope pointed at the same declination for several successive scans so they swept through larger galactic longitudes and smaller galactic latitudes. (It turns out that we should have adjusted the declination to point at the same galactic latitude but increasing galactic longitude, but fuzzy brains of newbie radio astronomers had a hard time making the coordinate transformations without the use of a computer—more about that later.)
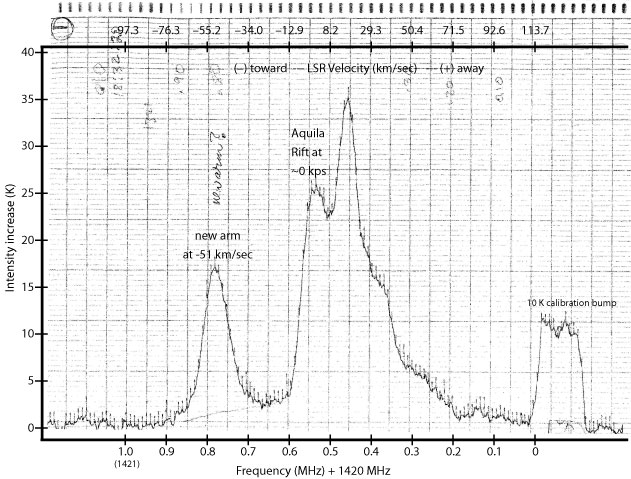
Figure 1
Now for some details about the new arm. Since the features at different frequencies correspond to neutral atomic hydrogen clouds moving at different velocities with respect to us, I looked for velocity images of the new arm. Most of the images below are from the pre-print of the Dame and Thaddeus (DT) paper that was tweaked a little after going through the peer review process before being published in the June 10, 2011 issue of the Astrophysical Journal Letters. None of the images in DT were changed. The image of HI at a galactic latitude of 5 degrees is from a Kalberla and Dedes (KD) paper published in the April 30, 2008 issue of the Astronomy & Astrophysics journal. Kalberla and Dedes give low resolution images of H1 in the Milky Way from out of the galactic plane: at galactic latitude +/- 5 and 10 deg. The new spiral arm shows up well in scans at +3 deg galactic latitude. DT give just a sub-section of a higher-resolution H1 map taken at +3 deg galactic latitude, so I will use the +5 deg KD image to provide context and then use the H1 sub-section map from DT for closer inspection.
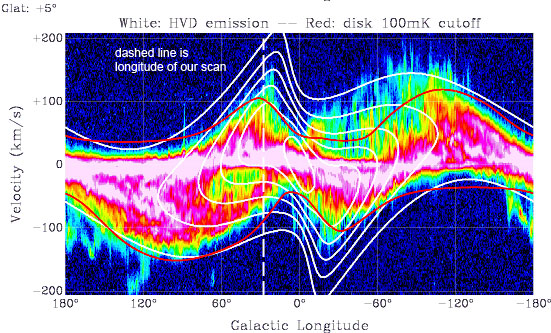
Figure 2
The image above from KD shows the velocity structure of neutral atomic hydrogen at galactic latitude b = +5 deg. I added a dashed vertical line to show the galactic longitude of the scan image above. The new arm appears to be present in this image as the diagonal red line of clumps intercepting the dashed line. Below is a figure from DT that is a sub-section of a higher resolution HI map at two galactic latitudes, 0 and +3deg (my figure 3 is DT's figure 1). The purple line in the bottom figure (for b=3deg) is the longitude of the scan image above. The purple line in the top figure (for b=0deg) is the longitude of a later scan (select the image to bring up a larger version).
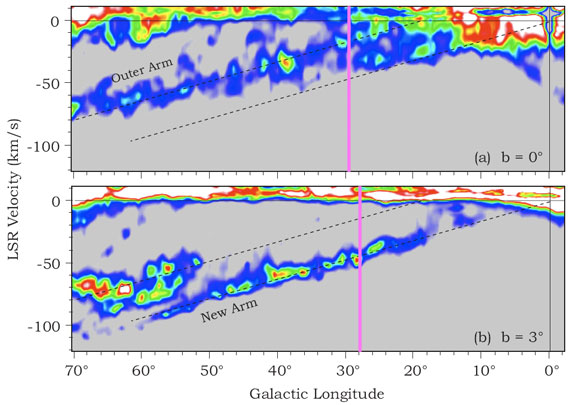
Figure 3
Putting both figures 2 and 3 together, we would expect the radio scan to show a slow rise up in intensity as the frequency increased from corresponding velocities of about +100 km/sec to about 0 km/sec with one bump at around 0 km/sec and other possible peaks in the +100 to 0 km/sec velocity range followed by a steep decline at larger frequencies (= more negative doppler speeds) to make a "valley", then a sharp peak in intensity at around 1420.7 to 1420.8 MHz, or about -50 km/sec. This is what is seen. In addition, another figure from DT (see their figure 3a) shows that the new arm at the given longitude has an integrated velocity of about 400 K km/sec. The integrated velocity of the peak in our scan has a value of around 280 +/- 60 K km/sec using a triangle shape for a crude estimate of the area under the peak; the uncertainty coming from where one decides to draw the base and height of the triangle. We're definitely in the ballpark.
A later scan (at 3:04 AM) at the same declination correponded to a galactic longitude l = 29.5 deg and latitude b = +0.1. This is the purple line in part (a) of the higher resolution HI map from DT above. The new arm feature disappeared and a different intensity peak was seen between 1420.60 and 1420.70 MHz or an LSR velocity around -22 km/sec. This corresponds to the Outer Arm of figure 3a above.
We conclude that the 40-foot telescope can easily detect the new arm. What would make our conclusion even stronger would be if we had pointed the telescope to ever greater galactic longitudes but the same galactic latitude and had seen the new arm intensity peak at greater and greater frequencies (more and more negative velocities). That would have been another night's observing session if we had another day to recover from a late night session but I had to drive on some windy roads to the Richmond airport on the afternoon of June 8th, so we decided to leave those observations for another student group to do.
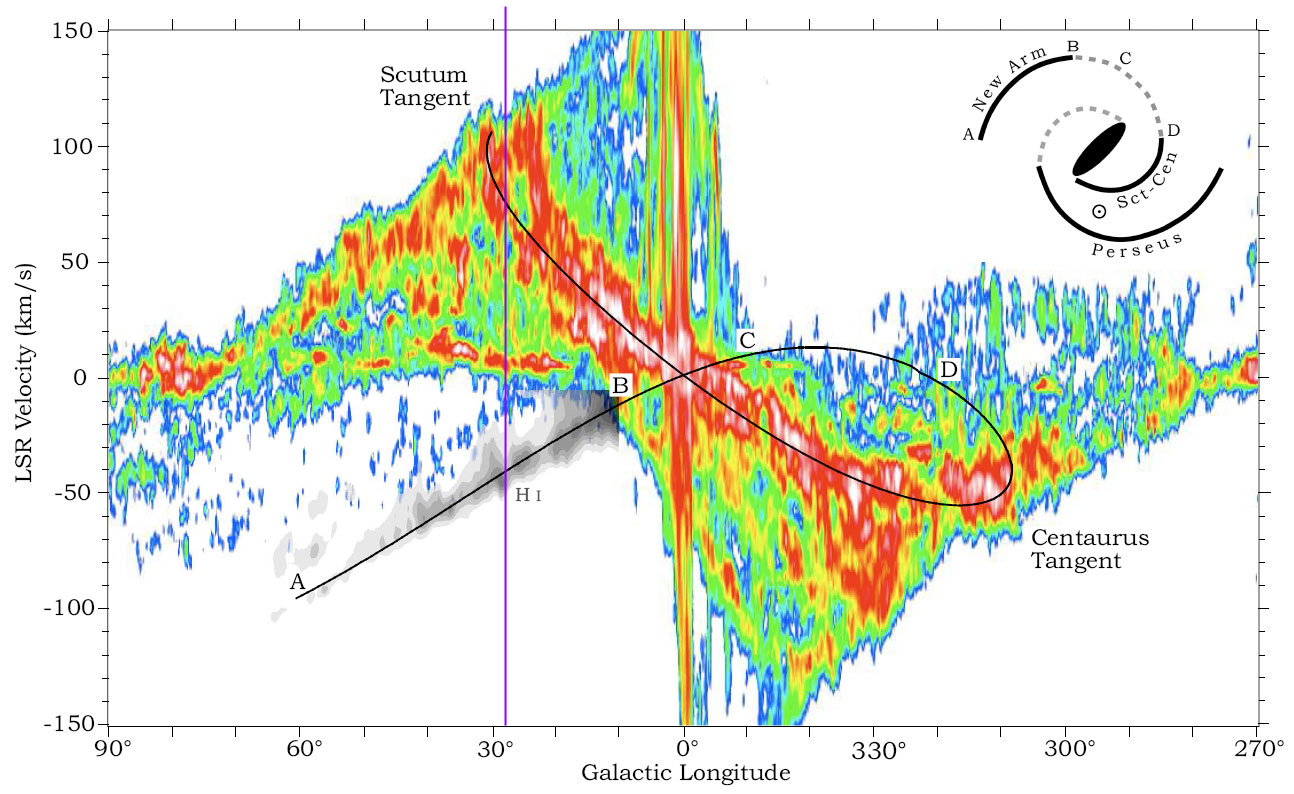
The figure from DT that "connects the dots" is their figure 4 that I include below (select the image for an enlargement). This velocity map is from their CO survey at galactic latitude b = 0 deg overlayed onto the H1 map at galactic latitude b = 3 deg. They include in the inset a top-down view of the galaxy showing just the two arms that extend from either end of the bar of the Galaxy. On top of that they drew in the velocities of the Scutum-Centaurus arm and what the velocities would be if the arm was extended to greater distances. They propose that the new arm is actually an extension of the Scutum-Centaurus arm to distances outside the distance of the Sun from the galaxy center. The purple line is the longitude of our scan for figure 1 above.
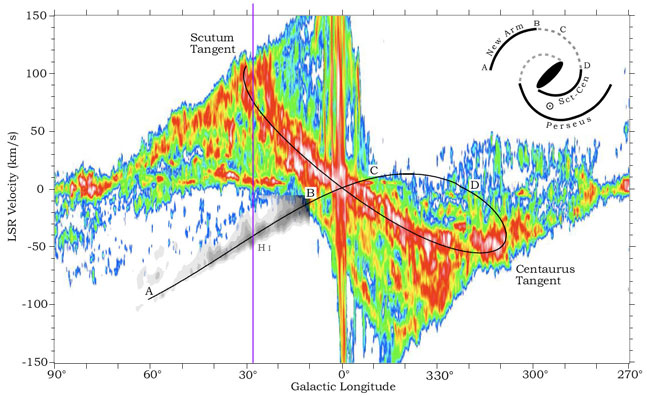
Figure 4 (= figure 4 of DT)
In the final figure below (figure 5) I overlay our scan (figure 1) on top of figure 4. Keep in mind that the color part is a map of CO at galactic latitude b=0 deg while our scan is of atomic hydrogen at galactic latitude b=3 deg. The horizontal feature at velocity at approximately 0 km/sec (the "Aquila Rift") is seen at a range of latitudes but other peaks can be found at a variety of places depending on the latitude of observation (and therefore, different clouds).
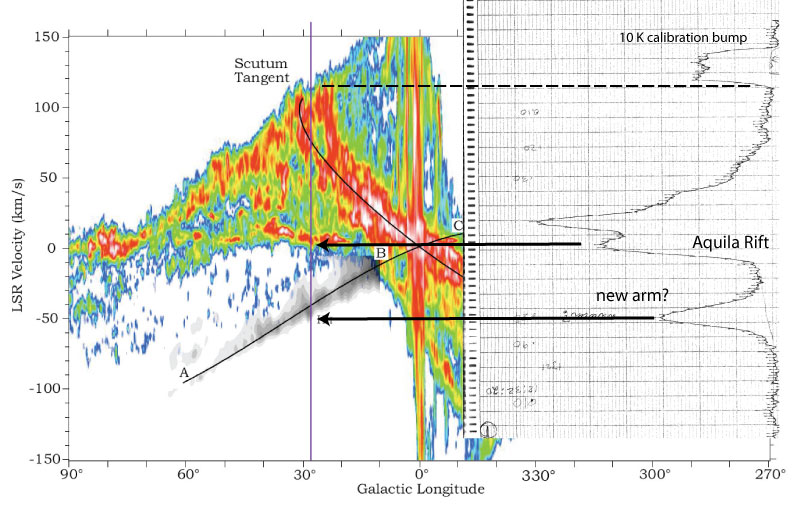
Figure 5
last updated:
September 14, 2011
Author of original content: Nick Strobel who assumes responsibility for any errors in this report.