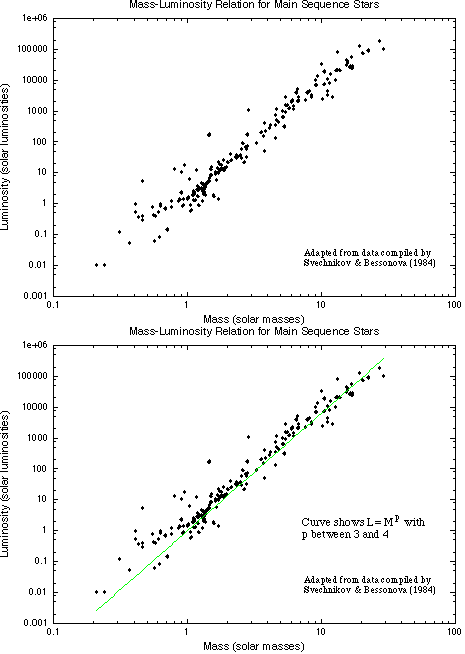
The mass-luminosity relation for 192 stars in double-lined spectroscopic binary systems.
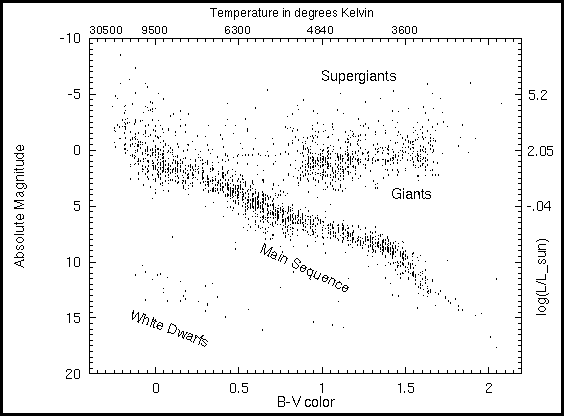
In order to better understand how stars are constructed, astronomers look for correlations between stellar properties. The easiest way to do this is make a plot of one intrinsic property vs. another intrinsic property. An intrinsic property is one that does not depend on the distance the star is from the Earth (e.g., temperature, mass, diameter, composition, and luminosity). By the beginning of the 20th century, astronomers understood how to measure these intrinsic properties. In 1912, two astronomers, Ejnar Hertzsprung (lived 1873--1967) and Henry Norris Russell (lived 1877--1957), independently found a surprising correlation between temperature (color) and luminosity (absolute magnitude) for 90% of the stars. These stars lie along a narrow diagonal band in the diagram called the main sequence. This plot of luminosity vs. temperature is called the Hertzsprung-Russell diagram or just H-R diagram for short.
Before this discovery astronomers thought that it was just as easy for nature to make a hot dim star as a hot luminous star or a cool luminous one or whatever other combination you want. But nature prefers to make particular kinds of stars. Understanding why enables you to determine the rules nature follows. A correlation between mass and luminosity is also seen for main sequence stars: Luminosity = Mass3.5 in solar units.

The hot, luminous O-type stars are more massive than the cool, dim M-type stars. The mass-luminosity relationship tells about the structure of stars and how they produce their energy. The cause of the mass-luminosity relation will be explored further in the next chapter.
The other ten percent of the stars in the H-R diagram do not follow the mass-luminosity relationship. The giant and supergiant stars are in the upper right of the diagram. These stars must be large in diameter because they are very luminous even though they are cool. They have a huge surface area over which to radiate their energy. The white dwarfs are at the opposite end in the lower left of the diagram. They must be very small in diameter (only about the diameter of the Earth) because even though they are hot, they are intrinsically dim. They have a small surface area and so the sum of the total radiated energy is small.
The H-R diagram is also called a color-magnitude diagram because the absolute magnitude is usually plotted vs. the color. The H-R diagram below is for all stars visible to the naked eye (down to apparent magnitude = +5) plus all stars within 25 parsecs. Luminous stars are easier to observe because they can be seen from great distances away but they are rarer in the galaxy. They tend to reside in the top half of the H-R diagram. Faint stars are harder to see but they are more common in the galaxy. They tend to reside in the bottom half of the H-R diagram.

Use the UNL Astronomy Education program's Hertzsprung-Russell Diagram module for another in-depth tutorial on the HR diagram via a graphical interface (link will appear in a new window).
How do you do that?A G2 star appears 25 times dimmer than it would if it was at the standard distance of 10 parsecs used for the absolute magnitude. The G2 star is at a distance of = 10 × Sqrt[1/(1/25)] = 10 × Sqrt[25/1] = 50 parsecs from us. |
Distances to red giant and supergiant stars are found in a similar way but you need to investigate their spectra more closely to see if they are the very large stars you think they are. Their position in the calibrated H-R diagram is found and their apparent brightness gives you the distance. Also, this process can be used to find the distance of an entire cluster. The entire color-magnitude diagram for the cluster is compared with a calibration cluster's color-magnitude diagram. The calibration cluster is a known distance away. Some adjustments for the cluster's age and composition differences between the stars in the cluster and the calibration cluster must be made. Such fine-tuning adjustments are called ``main-sequence fitting''.
![]() Go back to previous section --
Go back to previous section --
![]() Go to next section
Go to next section
last updated: June 18, 2022