The Sun is often said to be an ``average'' or ``typical'' middle-aged star. What is ``average'' depends on how you choose your sample!
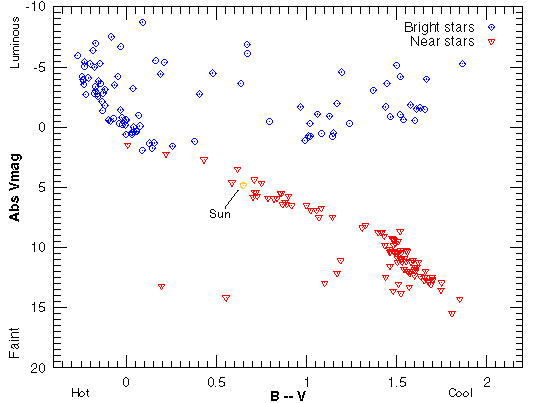
If you picked stars at random from our galaxy, what would they tend to look like? How the stars are selected can give you very different answers of what a typical star is like. The figure below shows where the 100 apparently brightest stars in our sky would be plotted and where the 100 nearest stars would be plotted on the H-R diagram. Both data sets are from the Hipparcos survey. The stars that appear bright in our sky also are intrinsically luminous for the most part. They are the diamonds in the diagram. The near stars are all within 7.63 parsecs of the Sun. They are plotted with the upside-down triangles. A great majority of the near stars are cool and faint.

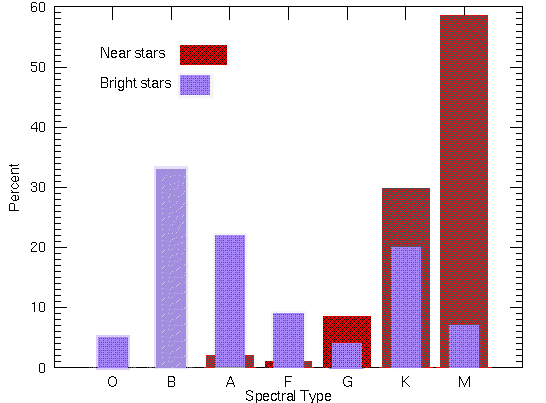
Another way to compare them is to plot the proportions of the spectral types for each group. As shown in the figure below, most of the apparently bright stars are the hot and luminous A and B-type stars. The sample includes a few of the very hot O-type stars. All but one of the K-type stars in the bright star sample are giants or supergiant stars. All of the M-type stars are giants or supergiants.
The graph for the near star sample looks very different: the majority of stars are the cool and faint K and M-type stars. Only one star in the entire sample is a giant star. The rest are main sequence stars.

Which of these samples is more representative of the entire population of stars in our galaxy? A representative sample includes all parts of the population of the objects your are investigating in their proper proportions. The relative proportion of common things will be greater than the relative proportions of rare things. In fact, the uncommon things may not be found in a small representative sample because they are so rare!
A poorly selected sample that is unrepresentative of the larger set can lead to biased results. Such biases can be found in any sample of objects or people. Public officials and politicians who base their decisions on what the polls say people believe or think about different issues, are usually working with biased samples of opinions. The pollsters will interview between 1000 to 2000 people across the nation and from that set, they get an idea of what the entire nation of several hundred million people believe. They get accurate results only if they have a sample of people that properly represents the entire population. It is extremely difficult (if not impossible) to get a representative sample for political polls. The situation for astronomy is easier and standard statistical methods can be used to find a representative sample of stars.
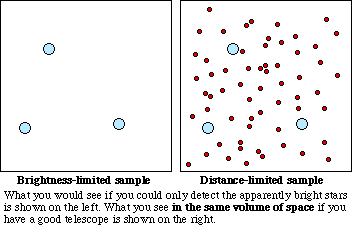
In our example of the types of stars, the bright star sample is very biased. The average distance between each star in the bright star sample is about 20 times greater than the average distance between each star in the near star sample. This gives us a rough idea of how spread out the luminous stars and faint stars are---the luminous stars are much more spread out than the cool faint stars. Therefore, in a given volume of space, there will be many more cool faint stars than luminous stars. The faint stars cannot be seen from the great distances the luminous stars are seen, so a sample based on the apparent brightness biases against the very numerous faint stars.

The situation is analogous to using meshes of different spacings between the mesh lines for sifting pieces of minerals on a beach. A coarse mesh with large spacings between the mesh lines will let the sand fall through so all you get are the large rocks. The sample of minerals you would get with the coarse mesh would be just the rare large rocks. A fine mesh with narrow gaps between the mesh lines will collect all the sand grains and the large rocks. The sample of minerals you would get with the fine mesh would be all of the pieces of mineral (sand + rocks) in that plot of beach and you would reach a much more accurate conclusion of the proportion of small mineral chunks (sand grains) to large mineral chunks (large rocks).
![]() Go back to previous section --
Go back to previous section --
![]() Go to next section
Go to next section
last updated: June 18, 2022