This material (including images) is copyrighted!. See my copyright notice for fair use practices. Select the photographs to display the original source in another window. Links to external sites will be displayed in another window.
Galaxies love to cluster together! Their mutual gravity can draw galaxies together into a cluster that is several millions of light years across. Some clusters have only a handful of galaxies and are called poor clusters. Other clusters with hundreds to thousands of galaxies are called rich clusters. The low mass of a poor cluster prevents the cluster from holding onto its members tightly. The poor cluster tends to be a bit more irregular in shape than a rich cluster.
Our Milky Way is part of a poor cluster called the Local Group (an imaginative name, yes?). The Local Group has two large spirals, one small spiral, two ellipticals, at least 21 irregulars, at least 1 dwarf elliptical, and at least 97 dwarf spheroidals (have lower luminosity than dwarf ellipticals and are spheroidal in shape; some lists will have some of the dwarf ellipticals listed as dwarf spheroidals). There may be over 18 additional dwarf galaxies in the Local Group. Statistical analysis of the massive data sets from deep surveys such as the Dark Energy Survey and the Vera C Rubin Observatory will probably find even more ultra-faint dwarf galaxies. The distribution of the brighter confirmed Local Group galaxies is shown in the figure below. The Local Group is about 3 million light years across with the two large spirals, the Milky Way and Andromeda Galaxy, dominating the two ends. Each large spiral has many smaller galaxies orbiting them. The proportions of the different types of galaxies in the Local Group probably represents the number of the different types of galaxies in the rest of the universe. The small galaxies can be seen in the Local Group because they are close enough to us but the dwarf galaxies are hard to see in far away clusters.
The closest large cluster to us is the moderately-rich cluster called the Virgo Cluster because it is in the direction of the Virgo constellation. It has many hundreds of galaxies (mostly spirals and irregulars) distributed into an irregular shape about 10 million light years across. It is about 49 to 59 million light years from us. Some ellipticals are present in the central part of the cluster including a giant elliptical at the center (M87) that has become so large by gobbling up nearby galaxies that were attracted by its enormous gravity. The total mass of the Virgo cluster is large enough that its gravity pulls nearby groups of galaxies (including the Local Group) toward it. See the zoomable map of the Local Group and the Virgo Cluster in our supercluster at National Geographic.
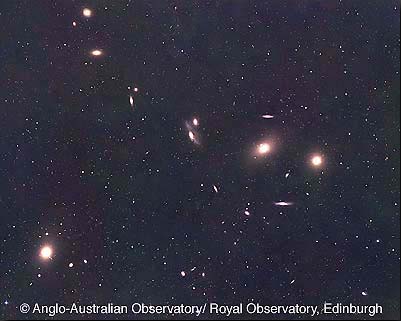
The center of the Virgo cluster has three giant ellipticals, M 87 (bottom left corner) and M 84, M 86 (center right). M 86 may be a lenticular S0 type instead. (Courtesy of AAO)
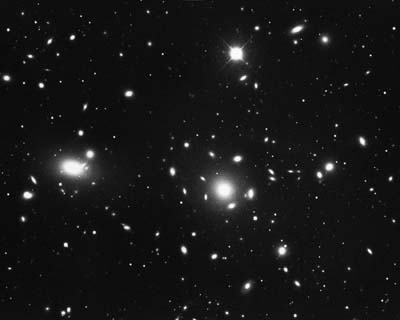
A rich cluster is seen in the Coma Berenices constellation—the Coma Cluster. It has thousands of galaxies (mostly ellipticals and S0 spirals) in a large, spherically-shaped cluster about 300 million light years from us. It is at least ten million light years across. The elliptical galaxies congregate toward the central regions while the few spirals are found on the outskirts. Two giant ellipticals (NGC 4874 & NGC 4889) occupy the central part of the cluster. Like M87 in the Virgo Cluster, they have grown very large from pulling in galaxies that were unfortunate to have strayed too close to escape the giant ellipticals' gravity. Other rich clusters show the same segregation of the spirals from the ellipticals as the Coma Cluster. Ellipticals gather together in the center of clusters while spirals prefer to stay close to the periphery.
 --
--
(Left/top): The Coma cluster is a rich galaxy cluster with
thousands of galaxies. (Courtesy of NOAO/AURA/NSF—now
NOIRLab/NSF/AURA)
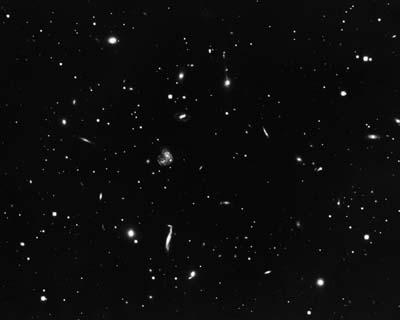
(Right/bottom): The Hercules cluster is a poor cluster with less
than a hundred galaxies. (Courtesy of NOAO/AURA/NSF—now
NOIRLab/NSF/AURA)
Galaxy clusters provide another probe of dark matter. Much like is done in measuring the masses of galaxies from the motions of the stars and gas clouds in them, you can use the motions of the galaxies in the clusters to measure the masses of the galaxy clusters. What you find is galaxy cluster members are moving too fast to be gravitationally bound unless there is unseen mass. The reasonable assumption is that we do not live at a special time, so the galaxies in the cluster must have always been close to each other. The large velocities of the galaxies in the clusters are produced by more gravity force than can be explained with the gravity of the visible (either shining or blocking light) matter in the galaxies. The extra gravity is supplied by the dark matter.
Astronomers have found that galaxy clusters have a lot of very hot gas (i.e., gas made of very fast-moving particles) in them with about two-thirds of it in between the galaxy members of the cluster. This gas is so hot that it emits in the X-ray band. The gravity of the galaxy clusters also gathers up gas and the gas heats up from the friction of the intergalactic gas particles bumping into each other. Again, we assume that we do not live at a special time, so to have kept the very fast-moving particles around, there needs to be extra gravity supplied by the dark matter.
An independent way of measuring the mass of individual galaxies and galaxy clusters uses the gravitational lensing effect described in the relativity chapter. The matter in a nearby object stretches the spacetime around the object so as light from a distant object passes through that stretched spacetime, it follows a curved path. The more mass there is, the greater is the stretching of spacetime. If the lensing effect is strong, then multiple images of a distant galaxy will be produced and the separation angle between the multiple images gives us the mass of the lensing object (in this case, the closer galaxy or galaxy cluster). If the lensing is weaker, multiple images of the distant galaxy will not be seen so the mass of an individual nearby lensing object (a galaxy) cannot be easily measured. However, if the light from many distant galaxies passes through the stretched spacetime of a nearby galaxy cluster, then the mass of the galaxy cluster can be derived from a careful analysis of the ensemble of warped shapes and their orientations. One example cluster is Abell 1689 shown below (select the image to learn about this cluster from the Space Telescope Science Institute). The gravitational lensing can also sometimes magnify the light of an otherwise too-faint, very distant galaxy enough for us to see it—a bonus natural telescope! The cluster Abell 1689 magnified the infrared light of an infant galaxy from 12.8 billion years in the past enough to just barely be detected by the infrared camera on the Hubble Space Telescope and by the Spitzer Space Telescope (see the STScI press release for more on that). More recent lensing discoveries have found lensed infant galaxies from even further in the past.
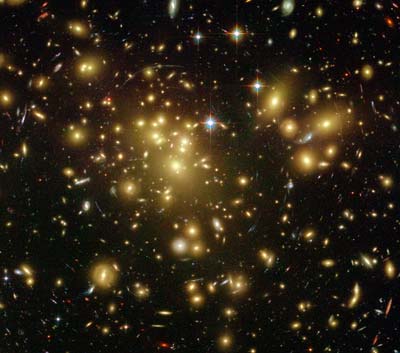
Gravitational lensing of the light from distant galaxies and quasars (super-active galaxies described later in this chapter) by closer galaxies or galaxy clusters enables us to calculate the amount of mass in the closer galaxy or galaxy cluster from the amount of bending of the light. The derived mass is greater than the amount of mass in the visible matter. Inventorying all of the ordinary matter in the lensing galaxy clusters (those that lens the light from distant galaxies) and comparing it to the total mass of the galaxy clusters gives a five-to-one ratio of dark matter to ordinary matter. An added feature of gravitational lensing is that it reveals dark matter even where there is no ordinary matter present, so gravitational lensing can be used to map the distribution of dark matter within AND beyond the extent of the glowing, ordinary matter.
When we do a careful accounting of all of the ordinary matter that can respond to electromagnetism (matter made of protons, neutrons, electrons, etc. either making light or blocking it), we find that the ordinary matter makes up less than 20% of the gravity of the overall matter and the remaining gravity seems to be from exotic particles predicted by particle theory but not yet discovered in our particle experiments such as at Fermilab and the Large Hadron Collider. As noted before, the exotic particles do not not interact with electromagnetic radiation of any wavelength (they do not emit or block or scatter light at all) and, as far as we can tell, they do not seem to interact with ordinary matter except through their gravitational effect, so finding them in the usual way with our particle accelerators is very difficult. (See the ADMX detector and the Xenon Dark Matter Project as a couple of examples.) The mass ratio of exotic particles to ordinary matter is five to one. Stronger evidence for the five-to-one mass ratio comes from looking at relics of the early universe as explained in the cosmology chapter.
The clustering phenomenon does not stop with galaxies. Galaxy clusters attract each other to produce superclusters of tens to hundreds of clusters. Their mutual gravity binds them together into long filaments (thin, stringlike structures) 300 to 900 million light years long, 150 to 300 million light years wide, and 15 to 30 million light years thick on average. The discovery of these huge structures was made from years of taking doppler shifts of thousands of galaxies. The doppler shifts of the galaxies were converted to distances using the Hubble-Lemaître Law. Between the filamentary superclusters are HUGE voids with very few (if any) galaxies. The voids are typically 150 million light years across.
Two pioneers in the mapping of the structure of the universe are Margaret Geller and John Huchra (lived 1948-2010). They and their students took thousands of spectra of galaxies along thin pie-shaped slices of the sky over 15 years to produce the map with 2 slices extending out about 400 million light years shown below. It would take much too long to take spectra of galaxies in every direction in space, so astronomers map the universe in slices oriented approximately perpendicular to the dust layer at the mid-plane of the Milky Way.
Courtesy of Geller, da Costa,
Huchra and
Falco.
In 2003, the Anglo-Australian Observatory (now called Siding Spring Observatory) released a much larger survey (“2dF Galaxy Redshift Survey”) of over 221,000 galaxies in two slices that extend over 1.5 billion light years in a two-degree field of the sky. The 2dF survey system could take the spectra of nearly 400 objects simultaneously, so it took them “only” 5 years to complete the survey. It is shown in the figure below. Each blue dot is a galaxy. The arrangement of the superclusters and voids looks like a bunch of soap bubbles or swiss cheese with the galaxies on the borders of the huge holes. Although the picture below is only a two-dimensional version of the three-dimensional map, you can still see the lacy, foamy structure. In 2009, AAO completed a six-degree field galaxy survey called 6dF Galaxy Survey that did not go quite as deep but gave greater detail of the local structure. Go to the 6DFGS Gallery for their pie slice maps.
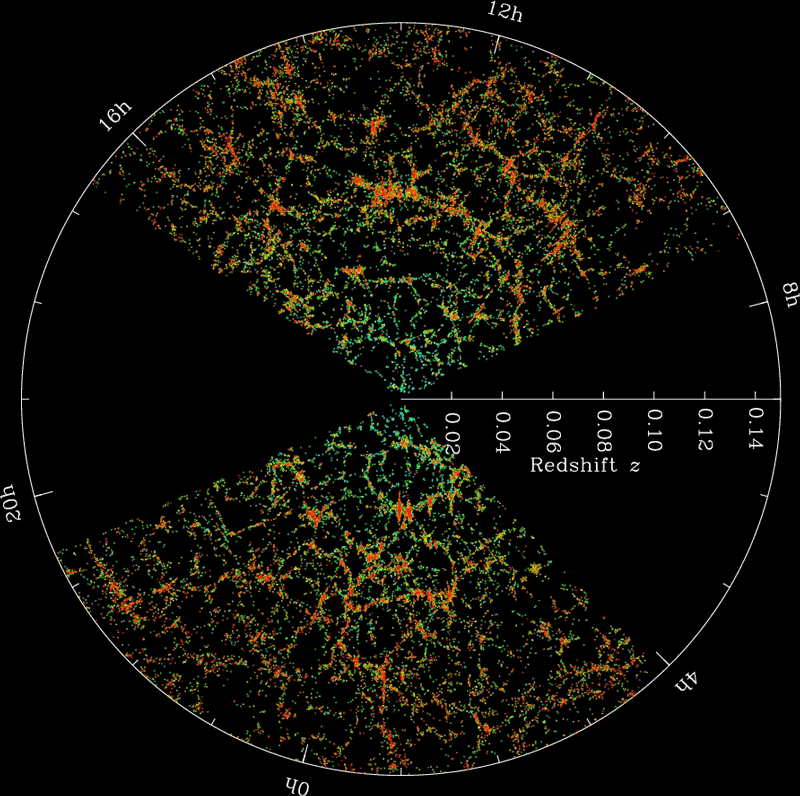
The Sloan Digital Sky Survey (SDSS) greatly expanded the volume to a million galaxies in one-quarter of the entire sky. SDSS measured spectra of more than 930,000 galaxies and 120,000 quasars as well as mapped the structure of the Milky Way by taking spectra of 240,000 stars and finding Type Ia supernovae to help us measure the history of the expansion of the universe. One of the pie slices is shown below from the first eight years of observation (2000–2008). It shows galaxies out to a lookback time of about 2 billion years (recall that greater redshifts are at greater distances and greater “lookback times”—we see the universe as it was). The regions between the wedges was not mapped because of the dust in the plane of the Milky Way. The SDSS map also shows the same sort of lacy, foamy large-scale structure. Later SDSS surveys expanded the volume and number of galaxies to over four million galaxies and quasars out to a lookback time of about 11 billion years (80% of the universe's history). The eBOSS group of SDSS-IV released a map and video fly-through that combined the first twenty years of observations in mid-July 2020.
What produces the long thin strands of clusters around the huge bubbles of empty space? Obviously, gravity is the force at work, but how has it worked to produce these structures? Dark matter must play a significant role but how it does that is not completely known. Astronomers are using powerful supercomputers to simulate the gravitational interactions of hundreds of millions of particles and they program guesses of the behavior of dark matter into the simulation code. The simulations are able to produce the filamentary structure and voids. The dark matter forms a web structure and the galaxies made of ordinary visible matter are found where the dark matter is densest.
The dark matter behavior that fits the observed galaxy clustering best comes from dark matter made of particles that are massive and weakly interacting, meaning that they do not feel the stronger forces like electromagnetism or the nuclear forces and respond only to gravity. Because ordinary matter can radiate its energy away, ordinary matter is able to form more concentrated clumps than dark matter can, so galaxies and galaxy clusters are embedded within larger dark matter clumps. Recall that the speed of the particles in an object slows down as the object's temperature decreases—as the object cools down. Since massive particles will move relatively slowly, the massive dark matter particle is called “cold dark matter” and creative astronomers who like acronyms have coined the term “WIMPs” for these particles which means “weakly-interacting massive particles”. Neutrinos have such a small mass that they move too quickly to form the galaxy cluster and supercluster structures we see (... their masses are too wimpy to be WIMPs). Neutrinos would be a form of “hot dark matter”. There are no particles in the Standard Model of Particle Physics that are WIMPs, so the nature of dark matter has been one major problem pushing physicists to explore extensions of the Standard Model.
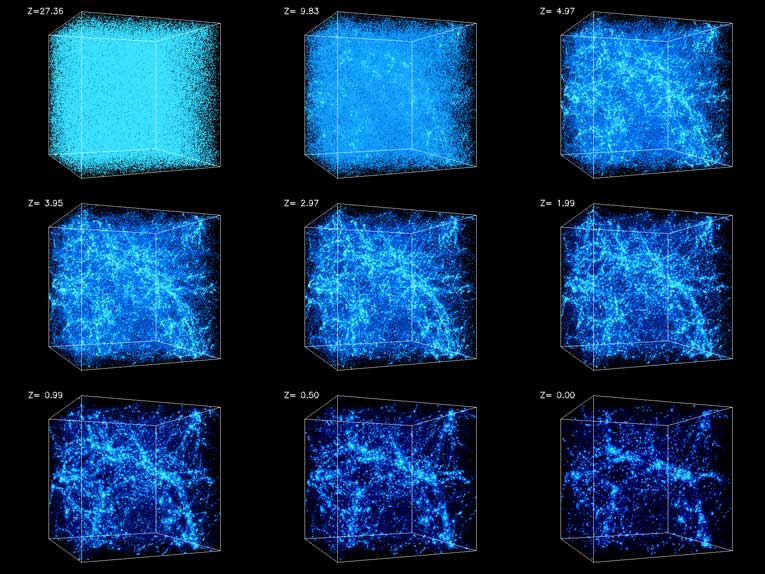
The picture below shows a supercomputer simulation of a 300 million light year cube of the universe using 47 million particles interacting with each other through the force of gravity. The galaxies clump together into clusters and the galaxy clusters gather together into huge string-like superclusters with big gaps (voids) in between. The colors represent differences in density: from lowest to highest density the colors are black, blue, pink, red, orange, yellow, and white (highest density peaks). The image is a much compressed jpeg version of a gif image from the HPCC group at the University of Washington. Some details have been lost in the compression, but you can select the image to bring up the original uncompressed gif file in another window (from the HPCC image gallergy)

Another nice set of pictures and movies of the formation of the large-scale structure can be found at:
![]() Go back to previous section --
Go back to previous section --
![]() Go to next section
Go to next section
last updated: July 3, 2026