Video lecture for this page
This material (including images) is copyrighted!.
See my copyright notice for fair use
practices.
Stars are dense hot balls of gas so their spectra similar to that of a
perfect thermal radiator, which produces a smooth continuous spectrum.
(Although, stars are not perfect thermal radiators, their spectra are similar enough to the smooth continuous spectrum for what follows.) Therefore, the color of stars depends on their temperature---hotter stars are
bluer and cooler stars are redder. You can observe the star through different
filters to get an approximate temperature. A filter allows only a
narrow range of wavelengths (colors) through. By sampling the star's spectrum
at two different wavelength ranges (``bands''), you can determine if the
spectrum is that for a hot, warm, cool, or cold star. Hot stars have
temperatures around 60,000 K while cold stars have temperatures around 3,000 K.
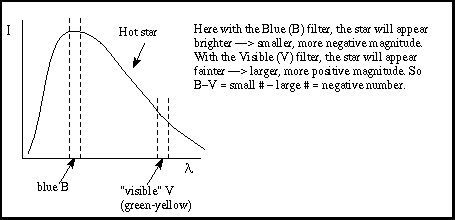
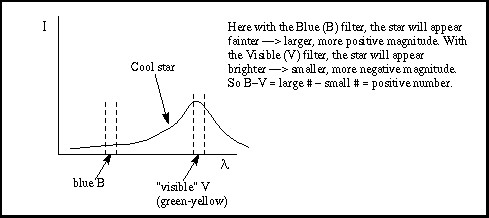
The filter diagrams are shown below.
Hot stars appear bluer than cooler stars. Cooler stars are redder than hotter
stars. The ``B-V color index'' is a way of quantifying this using two different
filters; one a blue (B) filter that only lets a narrow range of colors or wavelengths
through centered on the blue colors, and a ``visual'' (V) filter that only lets
the wavelengths close to the green-yellow band through.
A hot star has a B-V color index close to 0 or negative, while a cool
star has a B-V color index close to 2.0. Other stars are somewhere in between.
Here are the steps to determine the B-V color index:
- Measure the apparent brightness (flux) with two different filters (B, V).
- The flux of energy passing through the filter tells you the magnitude
(brightness) at the wavelength of the filter.
- Compute the magnitude difference of the two filters, B - V.


The UNL Astronomy Education program's Blackbody
Curves and UBV Filters module lets you explore the
relationship between temperature and the thermal spectrum by manipulating
various
parameters
with a graphical interface (link will appear in a new window). You can
also explore temperature-color correlation using various filters.

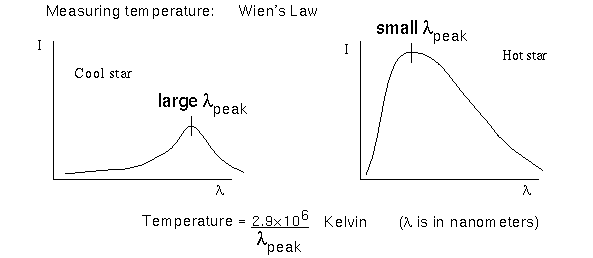
Another way to measure a star's temperature is to use Wien's law described in
the Electromagnetic
Radiation chapter.
Cool stars will have the peak of their continuous
spectrum at long (redder) wavelengths. As the temperature of a star increases, the
peak of its continuous spectrum shifts to shorter (bluer) wavelengths. The final way
to measure a star's temperature is more accurate than the previous two methods.
It uses the strength of different absorption lines in a star's spectrum. It
is described in full a little later in the chapter. The temperatures of
different types of stars are summarized in the
Main Sequence
Star Properties table.
 Go back to previous section --
 Go to next section
last updated:
June 18, 2022
Is this page a copy of Strobel's
Astronomy Notes?
Author of original content:
Nick Strobel


