This material (including images) is copyrighted!. See my copyright notice for fair use practices. Select the photographs to display the original source in another window. Links to external sites will appear in a new window.
Video lecture for this page
See the Astronomy course Canvas for links to video lectures for other pages on Astronomy Notes.
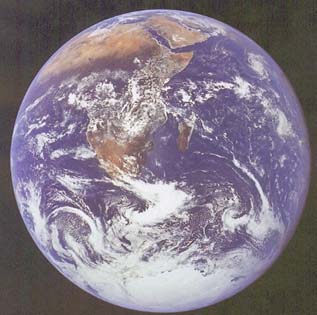
Our home planet, the Earth, is the largest of the terrestrial planets with a diameter of 12,742 kilometers and a mass of 5.9736 × 1024 kilograms. It has a moderately-thick atmosphere that is 78% nitrogen (N2) and 21% oxygen (O2). Although the atmosphere makes up less than 0.0001% of the Earth's mass, it is a very important component. The Earth has the right surface temperature and atmospheric pressure for life and liquid water on the surface to exist. It is the only place that has either of these things. Some water is also in the form of water vapor and ice. The total amount of water on the Earth (in all phases) is about 0.023% of the Earth's mass—the Earth is primarily rock and iron. The Earth is also a very beautiful place.
 Most of the Earth's water is
liquid and some is frozen. The rest that is water vapor
works with carbon dioxide in the atmosphere to create a small greenhouse effect,
raising the surface temperature about 34° C. This natural greenhouse effect makes it warm
enough on the surface for liquid water to exist. Besides making life possible, the
liquid water
also helps to keep the amount of atmospheric carbon dioxide from getting too high.
Carbon dioxide dissolves in liquid water to form “carbonic acid” (soda water).
Some of the dissolved carbon dioxide will combine with minerals in the water and settle
to the ocean floor to form limestone. A similar process happens with the weathering process. Carbon dioxide dissolved in rainwater (and in snowmelt) combines with minerals eroded away from the mountains to carry carbonates down to the oceans. The amount of atmospheric carbon dioxide is
also kept in check by biological processes.
Most of the Earth's water is
liquid and some is frozen. The rest that is water vapor
works with carbon dioxide in the atmosphere to create a small greenhouse effect,
raising the surface temperature about 34° C. This natural greenhouse effect makes it warm
enough on the surface for liquid water to exist. Besides making life possible, the
liquid water
also helps to keep the amount of atmospheric carbon dioxide from getting too high.
Carbon dioxide dissolves in liquid water to form “carbonic acid” (soda water).
Some of the dissolved carbon dioxide will combine with minerals in the water and settle
to the ocean floor to form limestone. A similar process happens with the weathering process. Carbon dioxide dissolved in rainwater (and in snowmelt) combines with minerals eroded away from the mountains to carry carbonates down to the oceans. The amount of atmospheric carbon dioxide is
also kept in check by biological processes.

Aquatic plants extract carbon dioxide dissolved in the water to use in their photosynthesis process. Aquatic animals use the carbon dioxide and calcium in the water to make shells of calcium carbonate (CaCO3). When the animals die, their shells settle to the ocean floor where, after years of compacting and cementing, they form limestone, locking up the carbon dioxide. A great majority of the Earth's carbon dioxide is buried deep below the surface in the form of carbonates. Some of the locked up carbon dioxide is released into the atmosphere via geologic heating processes such as volcanism.
Earth is unique in that its crust is broken up into chunks called “plates” and these “plates” jostle about because of the convection motion of the mantle below the crust. Among other things plate tectonics does in keeping our planet habitable, plate tectonics play a key role in regulating the amount of carbon dioxide in the Earth's atmosphere. Carbon dioxide in the atmosphere dissolves in rainwater. The slightly acidic rainwater erodes land rocks and the broken down minerals are carried to the oceans via the runoff. Calcium in the broken down minerals combines with the dissolved carbon dioxide in the oceans to create carbonates such as limestone at the ocean floor. Through plate tectonics, mountains are formed when plates collide and weathering of the mountains removes carbon dioxide from the atmosphere and puts it onto the ocean floor. Through plate tectonics, the limestone and other carbonate minerals are carried to subduction zones where they are melted. The melted rock releases carbon dioxide through volcanoes. (Plate tectonics giveth; plate tectonics taketh away.) Volcanoes are the major natural (non-human) way that carbon dioxide is released back into the atmosphere over tens of millions of years of time (in the short term they are just a hundredth of the human annual contribution). The figure below shows some of the plate tectonics events with climate changes over the past 540 million years using the changing ratio of oxygen-18 to oxygen-16 as a proxy for temperature changes as discussed in a previous section. A one part in 1000 change in the oxygen-18 corresponds to a 1.5 to 2 degrees Celsius change in the sea surface temperature.

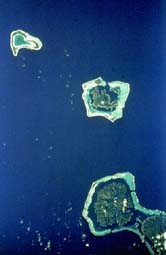
The formation of the limestone happens most easily in shallow water. On Earth the presence of continents makes it possible for places of shallow water to exist. The continents are created from lower-density material than oceanic plates through the subduction process of plate tectonics. Liquid water plays a key role in helping the subduction process of plate tectonics to work by lowering the melting point of the oceanic crust and keeping the lithosphere pliable enough to bend and descend far enough into the mantle to melt. In turn the temperature regulation of plate tectonics enables liquid water to remain on the Earth's surface.
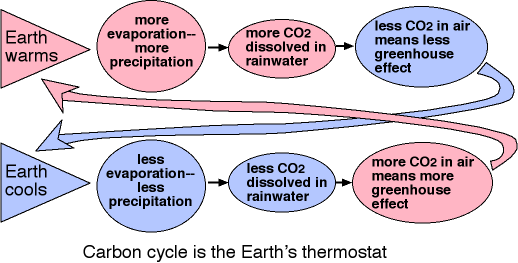
The temperature regulation happens because of a negative feedback process that cools the Earth if it gets too hot and warms the Earth if it gets too cool. The rate that carbon dioxide is removed from the atmosphere depends on the temperature such that the higher the temperature, the higher the rate that carbon dioxide is removed. If the Earth warms up, there will be more evaporation and rainfall, resulting in greater removal of atmospheric carbon dioxide. The reduced atmospheric carbon dioxide leads to a weakened greenhouse effect that counteracts the initial warming and cools the Earth back down. If the Earth cools off, the rainfall decreases, resulting in less removal of atmospheric carbon dioxide. The atmospheric carbon dioxide level will build back up because of the outgassing of volcanoes. A strengthened greenhouse effect counteracts the initial cooling and heats the Earth back up. This “thermostat” temperature regulation takes at least half a million years to adjust the temperature, so we cannot look to it to solve the short-term changes to the global climate discussed in the next sub-section. A good illustration of positive and negative feedback loops is the “DaisyWorld” world model video (see also this link to the video).
The thermostat did not work as well before about 540 million years ago. The Snowball Earth episodes discussed in a previous section alternated with episodes of extreme warmth (“hothouse Earths”) with large amounts of carbon dioxide in the atmosphere. A large amount of carbon dioxide would have been needed to provide the amount of greenhouse warming necessary to melt the ice. Recall that glaciers leave piles of rubble. Several layers of rubble piles are found in dozens of places on the Earth dated between about 800 million to 600 million years ago and these places would have been near the equator at those times. Right above the glacial rubble pile layers are found layers of carbonate deposits (“cap carbonates”). Ordinarily, such a juxtaposition of these two types of layers is not found, nor expected because glacial deposits are usually found in higher (cooler) latitudes while carbonates form easily in lower (warmer) latitudes. The Snowball Earth theory predicts that a hothouse Earth would follow a snowball Earth; just what is seen in the geological record. The carbon cycle thermostat would have then worked to bring the temperatures to more moderate levels. Interestingly, it may be the presence of multi-cellular life, particularly worms, that has prevented the large temperature swings from happening again. Worms in the ocean sediments wiggling about prevent the methane and carbon dioxide from getting locked away and bringing on too large a drop in the greenhouse effect. Complex, multi-cellular life did not evolve until around 540 million years ago—after the last Snowball Earth-hothouse Earth swing.
See the Met Office's page on climate for more details about the carbon cycle thermostat and about other feedback processes. NASA also created a nice site on the Carbon Cycle in their Earth Observatory program and a nice video on the carbon cycle as part of the “Tides of Change” series for Earth Science Week 2009 (see episode 6). Finally, check out the Carbon Cycle animation created by the Environmental Protection Agency for children. For more on long-term climate regulation including the Snowball Earth theory, see chapter 12 of The Earth System by Kump, Kasting, and Crane and Michael Wysession's How the Earth Works lectures (esp. lectures 37 to 39) from The Great Courses. Some early work on the Snowball Earth theory is also found on the Snowball Earth website.
This whole process of the cycling of the carbon dioxide in the water, life, rocks, and air is called the carbon cycle or the carbon dioxide cycle in geology and oceanography. There is the equivalent of 35-50 atmospheres of CO2 locked up in the Earth's rocks as carbonates. The contribution of carbon dioxide from the burning of fossil fuels by humans is a new input into this cycle with uncertain consequences. We are inputting carbon dioxide into the atmosphere at about 120 times the natural rate of carbon recycling (from Turco, Earth Under Siege p. 307). How do we know that the increase in carbon dioxide is due to fossil fuel burning?
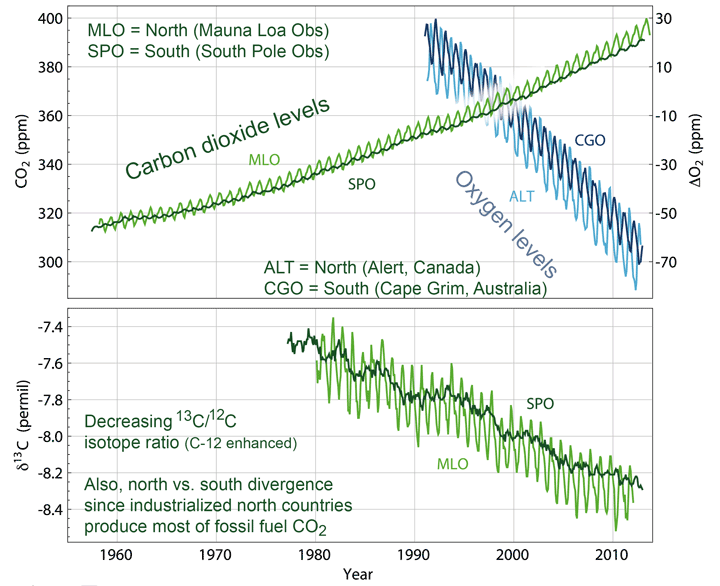 The top graph shows the recent carbon dioxide increase measured from the north and south
hemispheres. The light green curve shows the data collected by Charles Keeling at the
Mauna Loa Observatory Hawaii (data
collection started in the late 1950s and now continues after his death in 2005). The dark green is from
the South Pole Observatory. The wiggles up and down are due to the increase of photosynthesis in the
spring and summer and decrease in the fall and winter. The northern hemisphere has more land—more
photosynthesizing plants, so the wiggles are more pronounced.
(Link to see one year of the
Earth's CO2 breathing on YouTube and link
to NASA visualization site with details.) If fossil fuel burning is producing the extra carbon
dioxide, we should see a decrease in the amount of oxygen. That is shown in the light blue (for Alert,
Canada) and dark blue (for Cape Grim, Australia) wiggles. Note that the scale for the oxygen plot has been
magnified to make it more easily visible.
The top graph shows the recent carbon dioxide increase measured from the north and south
hemispheres. The light green curve shows the data collected by Charles Keeling at the
Mauna Loa Observatory Hawaii (data
collection started in the late 1950s and now continues after his death in 2005). The dark green is from
the South Pole Observatory. The wiggles up and down are due to the increase of photosynthesis in the
spring and summer and decrease in the fall and winter. The northern hemisphere has more land—more
photosynthesizing plants, so the wiggles are more pronounced.
(Link to see one year of the
Earth's CO2 breathing on YouTube and link
to NASA visualization site with details.) If fossil fuel burning is producing the extra carbon
dioxide, we should see a decrease in the amount of oxygen. That is shown in the light blue (for Alert,
Canada) and dark blue (for Cape Grim, Australia) wiggles. Note that the scale for the oxygen plot has been
magnified to make it more easily visible.
The bottom graph shows the reduction (more negative) of measured carbon-13 to carbon-12 isotope ratio as only happens with fossil fuel burning. This is the chemical signature of fossil fuel burning. (Figure 5.6 of the 2021 report shows the trends through 2020.) Biochemical reactions have a preference for carbon-12, so biologically produced materials will be enriched in carbon-12 (or proportionally reduced in carbon-13) compared to the carbon in inorganic materials. See the IPCC Working Group I report for further details and references to the peer-reviewed research on the use of carbon isotope ratios (esp. see section 5.2.1.2 Atmosphere). See the RealClimate posting for a detailed answer to this question. Both graphs also show that the levels in the north and south hemispheres are slowly diverging, separating from each other, over the decades because the industrialized countries in the north produce most of the fossil fuel carbon dioxide. The IPCC Working Group I report (especially chapter 5) gives other proofs of the human contribution to the atmospheric carbon dioxide levels.
Could this artificial input into the carbon cycle upset the natural balance and create a runaway greenhouse effect like that on Venus? Maybe. How much would it take to tip the balance? We do not know. We are in the midst of a great planetary experiment. Current estimates of the amount of carbon dioxide locked up in fossil fuels say that it is highly unlikely that burning all of the fossil fuels will create a runaway greenhouse effect. As mentioned above, carbon dioxide levels and global temperatures many millions of years ago have sometimes been much higher than what they are today. HOWEVER, while life in general and the Earth will survive “just fine” regardless of whatever amount of warming we cause, the particular form of life known as human (Homo Sapiens) requires cooler temperatures to be comfortable (or even survive). Furthermore, it does not take a large change in the global average temperature to create huge stresses that could threaten the survival of human civilization.
To put things into perspective on how much difference just a few degrees change in the global average temperature can make, recall the temperature plots from the ice core data discussed in the Weather vs. Climate section. Approximately 6 degrees Celsius in the global average temperature separates the pleasant environment today from the last ice age when there were ice sheets over a kilometer thick covering a lot of our land. If you zoom in on the past 120,000 years, you will notice that the global temperature has been remarkably stable for a stretch of time longer than other interglacials—about 11,570 years. The temperature graph is from data courtesy of Jouzel, J., et al.
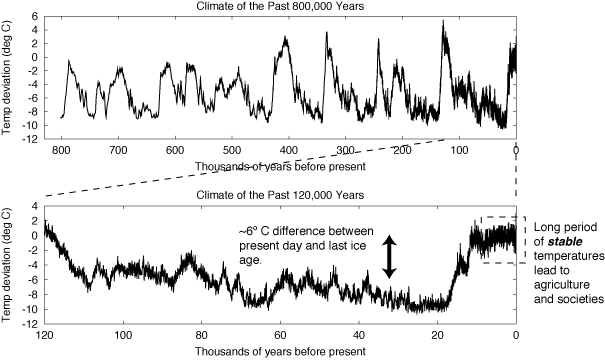
Art and culture are about 30,000 years old but agriculture and settlements (societies) did not exist until about 10,000 years ago. Agriculture and complex societies seemed to take about a thousand years of climate stability (and a stabilized sea level) to get organized. Archaeology has shown that minor climate changes have resulted in significant social disruption in great civilizations of the past which may have implications for us in how we will deal with climate change in the future (see a video archive of Ron Blom's talk on this at JPL on June 9, 2011; Michael Wysession's How the Earth Works lecture 41; and Dixit, et al's paleoclimate evidence for the decline of the Indus civilization). The carbon dioxide graph is from data courtesy of Luthi, D., et al. You can get the current atmospheric carbon dioxide amount from UCSD's Keeling Curve website.
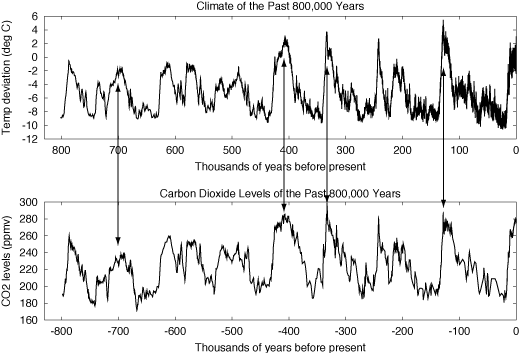
The pre-historic climate records show that carbon dioxide levels have tracked the temperature changes very closely but there is some controversy about what causes what (did temperature change before carbon dioxide levels or was it the other way around?) because the age determinations of the components in the ice core data cannot be made with sufficient resolution to definitively determine what came first. The climate feedback processes discussed in the weather vs. climate section can make a cause-effect relationship between carbon dioxide and temperature in the past tricky to establish. Past climate changes such as ice ages/interglacials have been triggered by changes in the Earth's axis tilt and orbit shape. In those cases, carbon dioxide/greenhouse effect and albedo changes have acted as feedback agents to enhance the effect of the axis tilt/orbit changes. Although the pre-historic climate records may show that greenhouse gas levels may have lagged behind temperature changes, the physics of the greenhouse effect has been well understood for well over a century now, so we do know what an increase in atmospheric carbon dioxide can do. Now we are adding carbon dioxide independently of any natural temperature changes and that extra carbon dioxide will be the triggering, forcing agent to a change in the global temperature via the well-understood greenhouse effect.
We do know that the amount of carbon dioxide contributed by human activity has had an effect and that it will be long-lasting because of the long time it takes for the extra atmospheric carbon dioxide input to be absorbed back into the Earth. The increase has happened in a very short timescale compared to past natural fluctuations in the carbon dioxide levels. Particular forms of life require much longer timescales to adapt to changes in global climate than what will occur with the rapid increase in the carbon dioxide levels. Therefore, the mix of species of life will undergo drastic changes in the next century or so. Human societies will need to adjust to those changes along with the changes of where food can be grown and changes in levels of available fresh water.
An excellent summary on the science of climate change is from the Intergovernmental Panel on Climate Change, particularly their WG I: The Physical Science Basis report. The Intergovernmental Panel on Climate Change (IPCC) is a review organization peopled by several hundred governmental and academic scientists from around the world. It publishes assessment reports every six or so years based on peer-reviewed literature. The IPCC does not do the climate research itself as an organization—it uses the results from the peer-reviewed research. The conclusions in the reports have to be agreed upon by politicians in all of the countries before they are published (and that includes the U.S.) so they tend to get watered down from the stronger conclusions from the scientists.
Climate studies use hundreds to thousands of measurements all over the globe to look at averages (remember the difference between weather and climate). Earth-observing science satellites have increased the number of measurements to many millions. Any data set will have some scatter about the mean (average) so you are bound to find some examples that are less than the observed average trend. You cannot cherry pick your data—honest work includes them all. All of the relevant physics and chemistry and ever-expanding and increasing resolution data sets of land, oceans, atmosphere, and ice are programmed into supercomputer simulations. The computer models continue to improve as the hardware increases in power and our understanding of the various feedback mechanisms improves. The computer models are checked and re-checked against the observed climate of the past 100 or so years.
The graphic below shows the temperature (beige panels), ocean heat content (light blue panels), and polar ice (white panels) changes (black lines in each of the panels) over the past decades along with models that try to fit what has happened in the past. The blue bands are results with 95% confidence level uncertainties of multiple climate models with just the natural agents of solar activity and volcanoes. The pink bands are results with 95% confidence level uncertainties of multiple climate models that include human-generated agents of change (“anthropogenic forcings”). Only the pink bands fit the observations (black lines). In trying to explain the warming that has already happened, climate models of different research groups using different inputs have found that the human factor must be included in the climate forcings (“forcings” are agents of change that can move a system out of balance). Models that include just natural forcings like the Sun and volcanoes show that the average temperature of the world and individual continents should have been stable (unchanged) since at least 1900—they cannot produce the observed change in global, continental, and ocean temperature.
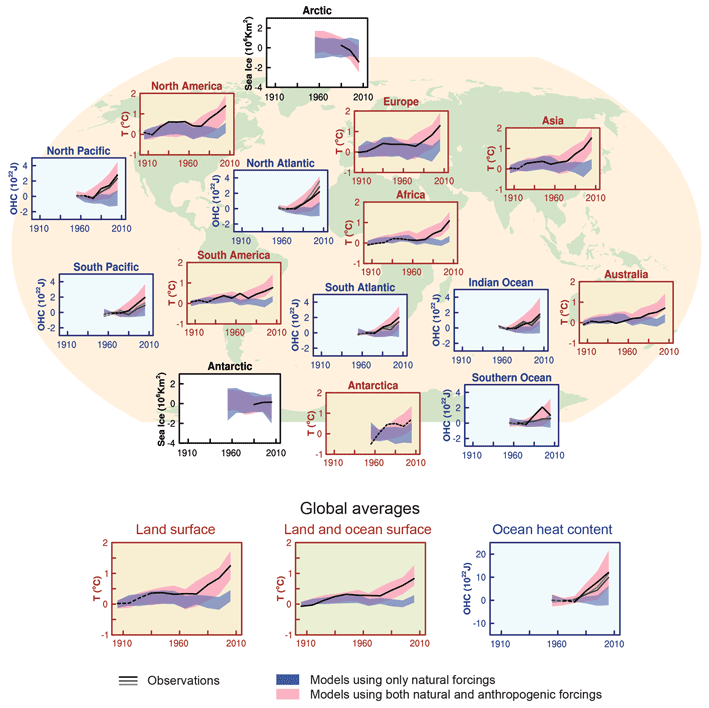
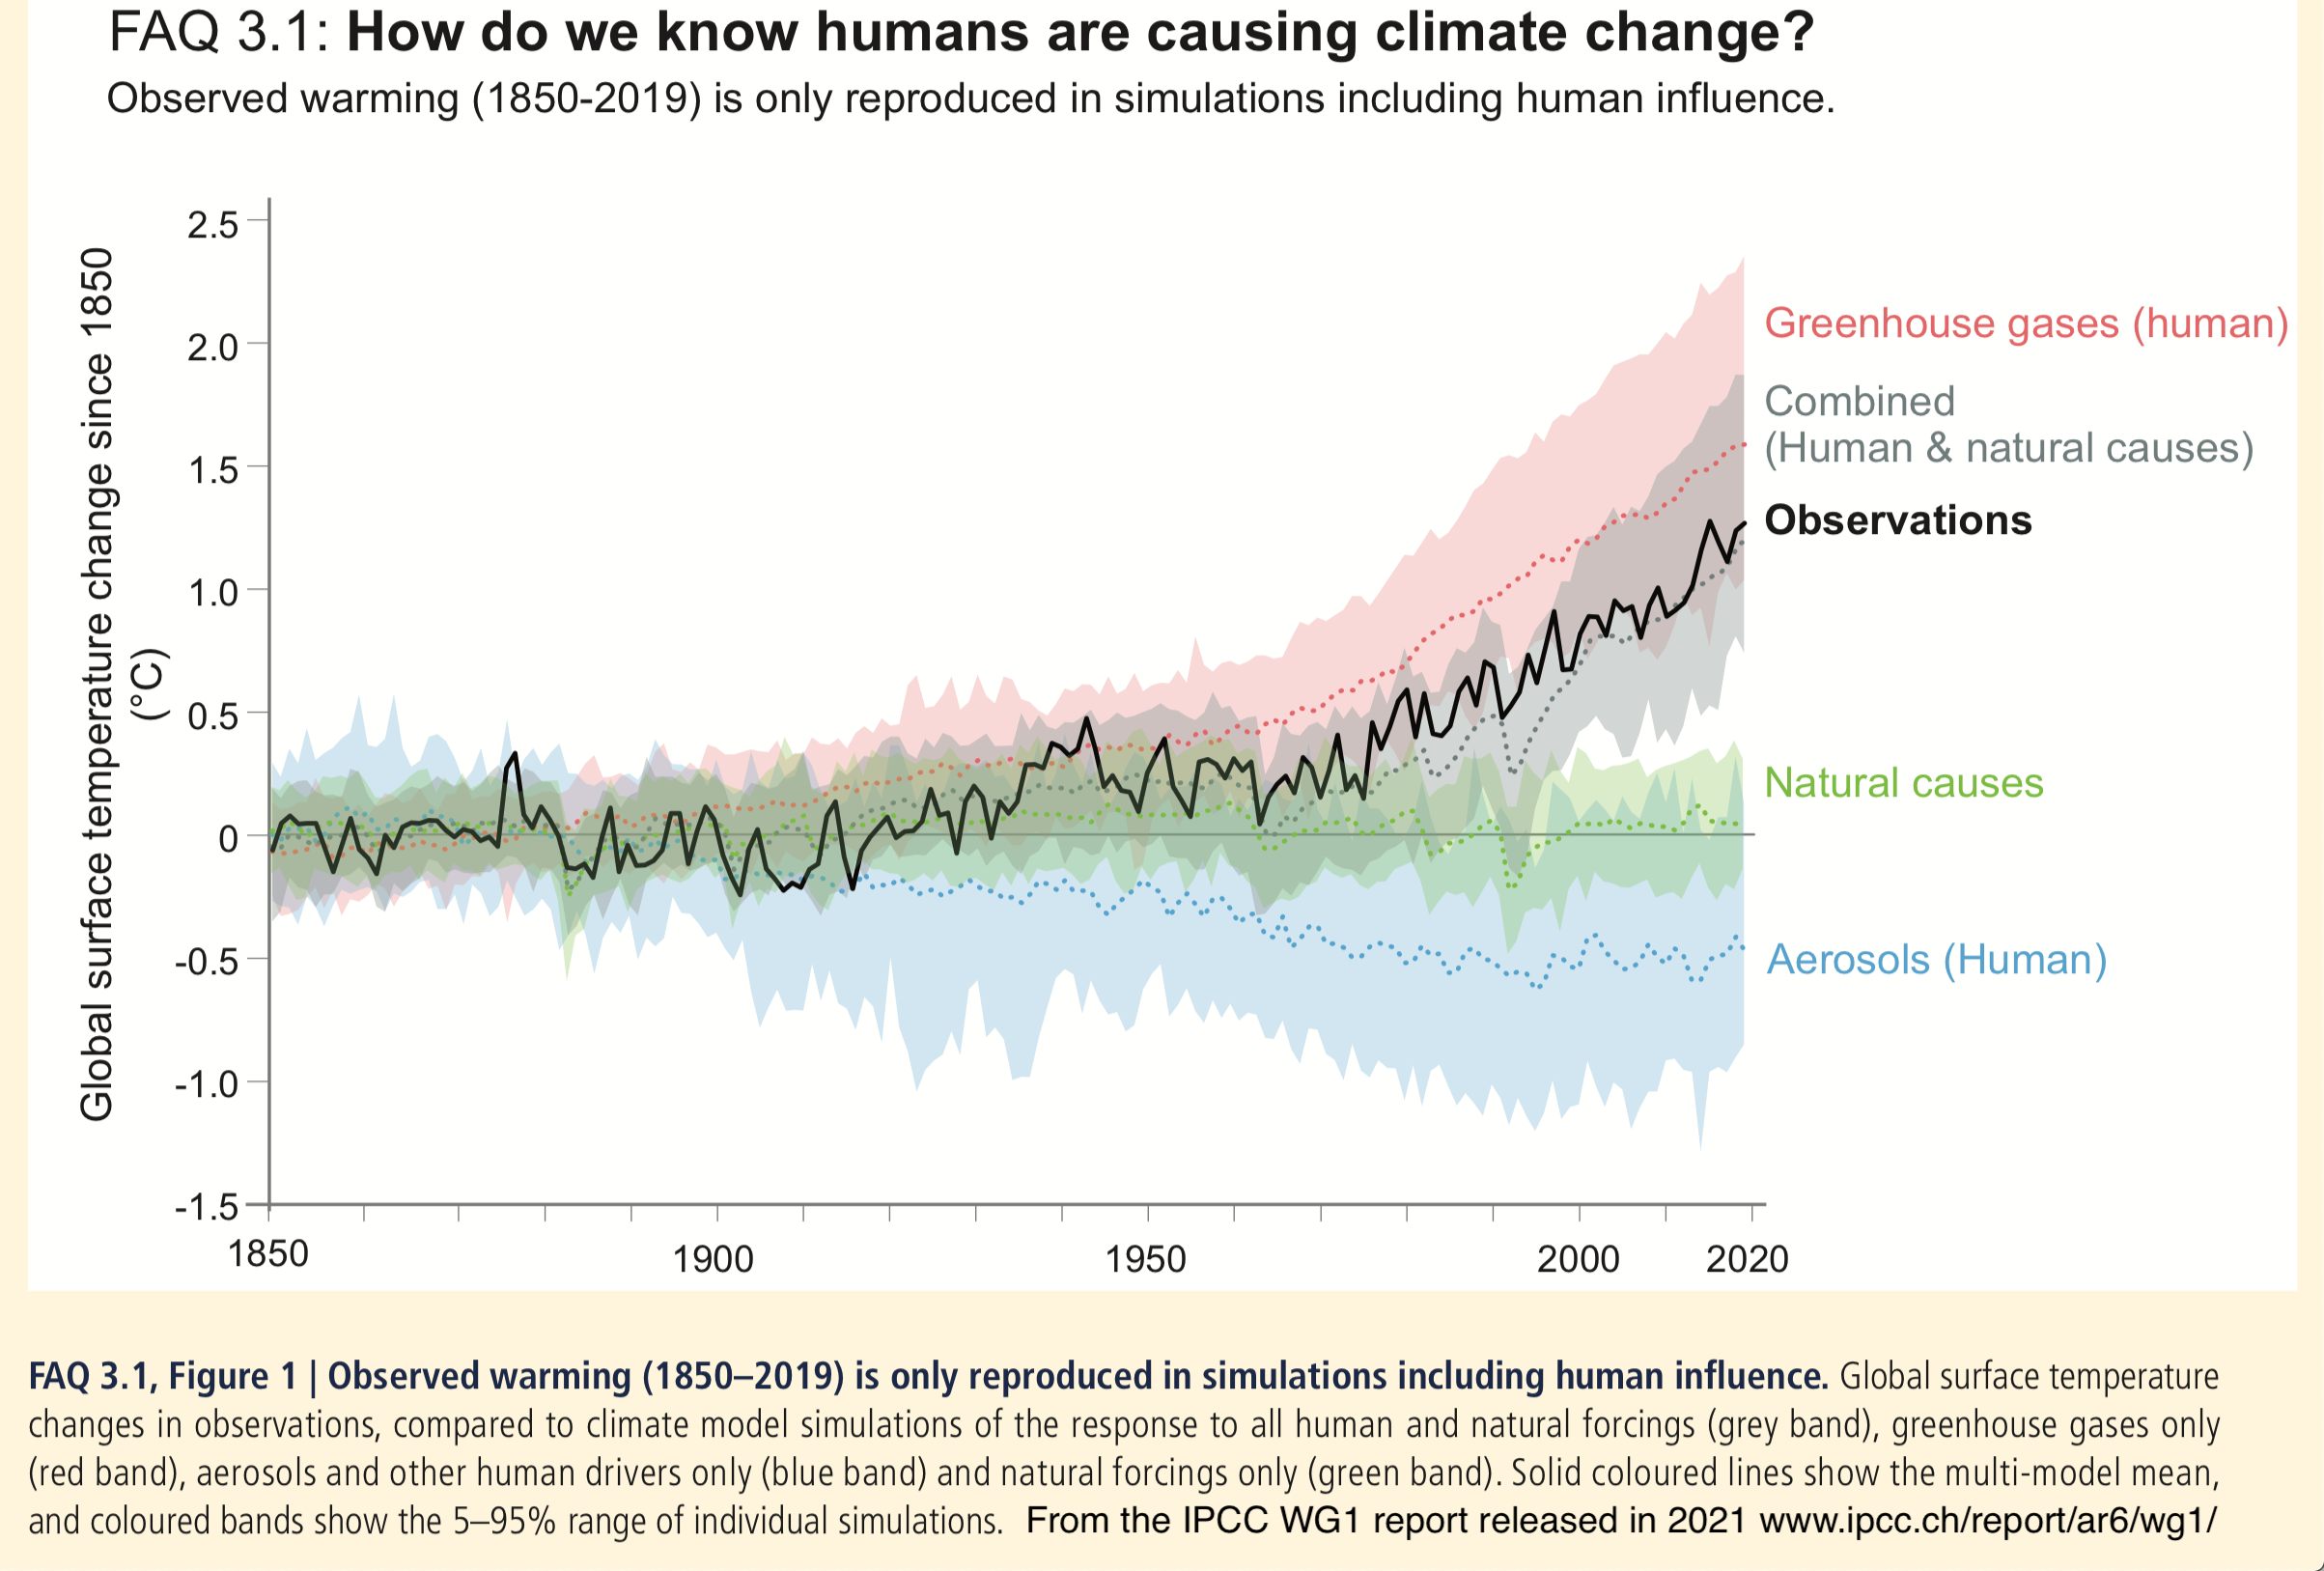
Below is an update of the temperature factor from the report of the Working Group 1 of IPCC released in 2021 and then the summary chart of the temperature, ocean heat content, sea ice extent, and precipitation (new to the 2021 report). The conclusion that humans are having a significant effect on the climate are only stronger with this new report.

Once a climate simulation model has been validated against the climate conditions in the past, i.e., reproduce the climate conditions we know existed in the past hundred or more years, they are used to make predictions of what will happen in the future assuming various scenarios such as: we either continue at the present rate of carbon dioxide emission, the rate of carbon dioxide emitted by humans continues to accelerate at the current observed acceleration, something in between, or we transition to non-fossil fuel energy production.
The discussion above has focused on temperature measurements but if climate change is real, there should be other indicators of changes in the climate. There are, including:
Unfortunately, it will take centuries, even millenia, for the additional (human-generated) amount of carbon dioxide to be removed via the processes described above even if we stopped all burning of fossil fuels today (see David Archer's book The Long Thaw for more on the timescales involved). Also, the climate change effects take decades to build up so people have been unwilling to make the needed changes in energy generation systems today. Sir John Houghton's 2005 testimony to the United States Senate Committee on Energy & Natural Resources gives a concise summary of the science of global warming and the resulting impacts on humanity from a significantly warmer planet. A PDF of his testimony exists on the Astronomy Notes site in case the original page gets moved.
A short summary of the evidence is posted as a PDF “How I Know”.
The controversy over global warming is being fought over in the popular media even though the consensus of the scientific community that actually researches climate change is that humans are having a greater impact on global warming than natural sources. The IPCC WG I report mentioned above has an excellent Frequently Asked Questions PDF download that includes questions raised by the skeptics. The overwhelming consensus of the scientific community who actually do climate research (i.e., those who are actively engaged in climate research, publish their results in peer-reviewed journals, and allow their conclusions to be tested by others) is that the global warming that is happening is mostly human-caused by the burning of fossil fuels. Any increase in solar luminosity has a much smaller effect on the climate. As a measure of the certainty of this, major insurance companies take the IPCC's conclusions into account in creating their business projections. Even the U.S. Department of Defense recognizes that climate change is happening and that it will bring stresses on food and water supply systems. Rather than belabor the point about the human-caused global warming by countering all of the objections of the skeptics on this page, please see my “Answers to Global Warming Skeptics” page for more on this. That page also has a “What Can You Do?” section for things you can do to reduce your own carbon footprint. Finally, while life in general and the Earth will survive “just fine” regardless of what amount of warming we cause, the particular form of life known as human (Homo Sapiens) requires cooler temperatures to be comfortable (or even survive). The predicted effects of global warming (such as sea level rise, increased forest fires, increased frequency of extreme weather events, etc.) will eventually lead to the expenditures of many trillions of dollars to mitigate those effects. To keep “business as usual”, are we also planning ahead for such large expenditures of money? On a more personal note, we need to address the fairness issue:
Prior to September 2017, the Carbon Dioxide Information Analysis Center at the Oak Ridge National Laboratory used to collect the data for analyzing carbon dioxide trends as well as data on other gases that respond to infrared, role of the biosphere and oceans in the cycling of greenhouse gases, fossil fuel burning emission of carbon dioxide, effect of land use changes (deforestation, paving over, etc.), and long-term climate trends, etc. In September 2017, the majority of the CDIAC data was moved to the U.S. Department of Energy's (DOE) Environmental System Science Data Infrastructure for a Virtual Ecosystem (ESS-DIVE) archive. The Oceanic Trace Gas data have been transitioned to the new Ocean Carbon and Acidification Data System (OCADS) operated by NOAA's National Centers for Environmental Information (NCEI). Caltech now manages the Total Carbon Column Observing Network (TCCON) data. HIAPER Pole-to-Pole Observations (HIPPO) data are now with the NCAR Earth Observing Laboratory. Pre-historic climate records can be examined at the NOAA Paleoclimatology website. See the “What Can You Do?” section for ways to reduce your own carbon footprint.
A flowchart of the carbon cycle on the Earth is given on the Earth-Venus-Mars page. While the flowcharts for Venus and Mars show what happened long ago, the flowchart for the Earth shows the cycle as it currently operates.
The temperature of the atmosphere decreases with increasing altitude above the surface up to the ozone layer. The temperature below the ozone layer is below the freezing point of water. If water vapor gets up too high in the atmosphere, it condenses and rains back to the surface. This height is below the ozone layer, so the water vapor does not get high enough to be dissociated—there is a “cold trap” below the ozone layer.
Within the past couple of decades, the ozone layer has been partially destroyed by some of the chemicals used in modern devices. One class of ozone-destroying chemicals are called chlorofluorocarbons (CFC's) that are used in aerosol sprays, the cooling fluid in older refrigerators and air conditioners and in making styrofoam. Most of the industrialized nations have taken steps to reduce the production of CFC's, but the CFC's already in the atmosphere will take some time to disappear and the ozone destruction will continue for a while. You may have heard that some ozone is produced by engines here on the surface. Unfortunately, that ozone does not make it to the ozone layer high up. Also, ozone can damage our respiratory system.
Go to pictures from the surface of our home planet
![]() Go back to previous section --
Go back to previous section --
![]() Go to next section
Go to next section
last updated: May 30, 2026